Due to the 1m drop in the coast, the 10m walls in Tarou (built to protect the town after previous tsunamis) could not withstand the 10m high tsunami waves, causing total destruction.
The footage below shows the sheer power and scale of the tsunami as it hits Kesannuma port
Localised flooding and the appearance of cracks in pavements and roads were caused by liquefaction. You can actually see the ground moving in the video below:
The airport in Sendai opened only 4 years ago and has now been completely destroyed by the tsunami.
In the town of Rikuzentakata, 95% of buildings were destroyed, 10,000 people (1/2 population) were missing and the entire town was wiped off the map.
In the isolated mountain community of Kahoku, the river that runs through the town usually has little water until the tsunami hit. The tsunami caused the river to flood, flooding most of the area around it.
The initial earthquake did not cause any damage to the Fukushima nuclear power plant, but instead the tsunami afterwards did, causing an explosion in one of the reactor buildings.
Train lines were severely damaged.
The death toll has reached a staggering 15,850 deaths with 6,011 injured and 3,287 missing according to the National Police Agency.
Overall, most of the severe impacts were caused by the tsunami rather than the ground shaking during the earthquake.
On March 11th 2011 at 2.46pm, Japan was hit by its largest earthquake in history with a magnitude 9 on the Richter scale (previously the largest was 8.4 on the Richter scale) the same as around 2 million atomic bombs!
The earthquake is believed to be caused by a sudden movement, releasing the hundred years of tension generated by the Pacific plate subducting under the Eurasian plate. The earthquake was so large it shifted Japan 3 metres out to sea, dropped the Japanese coast over a metre and even knocked the earth off its current axis by 25cm, shortening the day by 1.8 micro seconds. The epicentre was located 100km off the coast of Sendai and the focus was 6km deep. The earthquake hit Sendai first with its P waves travelling at 6km a second and the always slower S waves travelling at 3km.
The earthquake affected all of the Eastern coast of Japan, taking around 100 seconds to reach its capital Tokyo and created ground shaking which lasted around 5 minutes, an abnormal time for an earthquake. Massive cracks were visible in the ground and during the shaking the ground was even seen to be expanding and contracting due liquefaction in some areas. Liquefaction occurs when the shaking of saturated sediment squeezes water to the surface.
Due to an epicentre located in the sea, and such a large explosion of energy from the earthquake a tsunami, over 10 metres high was created. The deep ocean and the massive moment meant the tsunami travelled at speed of 60kmph, taking only an hour to reach the coast. The tsunami, hitting Ofunato first then Sendai then Miyako, was superior to tsunami defences such as sea walls which had been weakened by the dropping of the coastline.
The tsunami is believed to have travelled up to 10km inland depending on the topography of the land, with flatter land allowing the tsunami to travel faster. In more developed places the water was seen to reach even higher height due to being squeezed between and over buildings. The tsunami travelled in both directions, toward Japan and out into the Pacific ocean, where places such as Hawaii receiving waves of 1 metre high.
Over 500 aftershocks were recorded during the week after the earthquake with some shakes, such as the one that killed 3 people and injured many others on 8th April, reaching a magnitude of 7.1. The map above (from the USGS) shows the sheer number of after shocks that have occured. Scientists have warned that Japan may face years of aftershocks as the fault continues to adjust and settle to its new position and pressures.
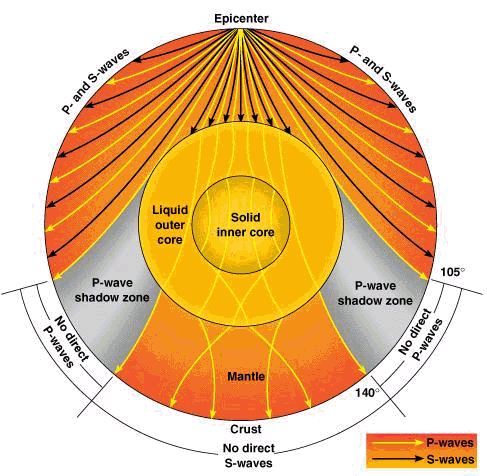
Hi all, remember in class we were studying seismic waves (P and S, L and R), and Mike pointed out they refract at the inner core as well as the outer core - but it didn't show it in the diagram? Well I finally found a diagram that does show it:
So as you can see only the P waves can penetrate the outer and inner core, the S waves get stopped at the core which is why you can't detect them past 105° ( about 11 000km) from the epicentre.
The P-waves can travel through everything but they also have a (smaller) shadow zone as they are refracted when they reach the outer (and inner) core. Remember that it's the surface waves (L and R) rather than the body waves (P and S) that cause all the damage as the send energy through the surface layers of the earth's crust. The behaviour of P and S waves enabled scientists to work out the inner structure of the earth.
Remember that P waves are also a lot faster than S waves, about twice as fast. This enables seismologists to use them to warn people in advance of an earthquake as the P-waves can be detected before the destructive S, L and R waves arrives. They only allow a 60-90 second warning at most but even this is better than nothing - enough to shut off gas and electricity supplies to prevent fires for example, or to leave your house or put protective padding on your head...
Liquefaction has been a feature of both Christchurch earthquakes, seen as tonnes of silt on the roads and sand volcanoes or sand boils on people’s lawns. This video shows what was happening under the surface of Christchurch during the earthquake.
Isn’t wonderful what a private citizen can teach with a spade, a wheelbarrow, some cobblestones, and a video camera. How many thousands would it have cost taxpayers like yourself if a government department was told to produce an equivalent demonstration?
The video is great, but ever since the earthquake I’ve wondered what was happening inside the soil during liquefaction. Make yourself comfortable while I explain it in plain English…
If you’re filling a jar with sugar and want to fit as much as possible into the jar you stop part way and shake the jar in order to create some empty space at the top. When you shake the jar the grains of sugar rearrange themselves so they can snuggle up closer and the size of the empty spaces between the grains is reduced.
Much of Christchurch is built on sandy soil and if that soil was perfectly dry an earthquake would shake the sand, the soil would settle like the sugar in your jar, and buildings would crack as they moved downwards to the new soil level*.
However, the sandy soils of Christchurch aren’t perfectly dry and there is water sitting between the grains of sand. The soil is like an old fashioned sponge which has lots of empty spaces that can hold water. When you squeeze a wet sponge you reduce the size of the spaces that hold water. The water is incompressible (it cannot become smaller in response to squeezing) and will not fit into the smaller spaces. When your house is too small you move out, and in a similar way the water moves out of the sponge. When you go the beach and stand on the sand just above the water’s edge you’ll soon find yourself standing in a puddle because your weight has squeezed the water out of the sand.
When a sponge has been squeezed gently the water moves out like water coming out of a garden hose, and when the sponge has been squeezed hard the water moves out like water coming out of a fire hose. Squeezing harder increases the water pressure.
Back to the soils of Christchurch. As the damp, sandy soil is shaken and settles like sugar in a jar the water between the grains is squeezed by the weight of the sand, buildings, roads, etcetera above it. In response to this squeezing the water wants to move out of the sand, but before it has a chance to do that another vibration from the earthquake causes more squeezing. More squeezing causes more water pressure, and two things happen:
1) The increased water pressure greatly reduces the forces that hold the sand grains together. To put it another way, as the water pressure increases each grain of sand finds it harder and harder to hold onto his neighbours. Eventually the water pressure reaches a point where the grains of sand cannot hold hands at all: now the soil has no internal structure and flows like a liquid. Liquefaction has occurred.
A tent with a frame inside it illustrates this. When the tent is set up properly is has shape and is strong. Take away the frame, which is the tent’s internal structure, and the tent collapses. When you take away the tent’s internal structure it goes from being a solid object to an object which flows like liquid. When you watch the video above you can see the sandy soil collapsing much like a tent.
When liquefaction occurs buildings drop down because they are no longer sitting on solid ground, just as the beach sand makes you unstable when you are standing close to the water’s edge.
2) As the shaking of the earthquake increases the water pressure the soil becomes like a little kid who is busting to go to the toilet. The water desperately wants to get out of the soil – just as it desperately wants to get out of a squeezed sponge – and the only way out of the soil is up. When this happened in Christchurch people saw water sitting on top of the ground, much like water sits on top of the beach sand as described above. As the water moves up it carries sand with it and the people of Christchurch saw sand volcanoes (also known as sand boils) and tonnes of sand on the streets.
It’s much like popping a pimple: your squeezing increases the pressure of the pus so that it takes the only exit and hits the mirror .
Here's two examples I did myself, there's still 24 letters left so please contribute! These took me about 10 minutes in total, so I'm not asking much of your time. If you need to any help let me know!
For everyone who thought the River Quaggy was a somewhat... uninspiring case study of soft engineering, how about the River Kissimmee in Florida? This is soft engineering on a large scale! Check out this website for more info! (if anyone wants to write up some case study notes to post on here they would be most welcome!).
Hey everyone! As you know open evening is coming up next Thursday, and I thought it would be great to create a proper wall display to show everyone what a great subject geography is and hopefully get more people excited about it! Another teacher in the college suggested a great idea - to create a border for the cork board using letters of the alphabet with geography words, so e.g. A is for... arid for example, and we can have 26 squares, each with a geography work and cool picture, e.g. Z is for Zeugen!
They need to be all the same format to keep it looking neat and professional, so I've come up with what I think will be a simple but effective way to do this. The idea is to use this website:
along with google maps/earth and to find a satellite picture of an interesting landform, landscape, settlement or even a whole country or continent, maybe we could have the whole earth for one of them. For example 'E is for Etna' and then have a picture of mount Etna.
For the 3 lines of text underneath you can add explanation or interesting fact about the picture, e.g. 'Etna is the talled active volcano in Europe' (or make it fill up 2 lines), then the third line can be for you name (to show they were created by students and not me!).
Try to chose something that you really like, you could chose the letter that your name starts with.
What do you think? Let me know if you need any help!! Once done please email to me and I will print it as we need to make sure they're all the same size. If you can do it by thursday that would be great but if not still have a go as there's plenty more open evenings coming up, and anyway, this isn't just for open evening but to make our classroom look nicer!!
I'll try to do an example soon to show you (I'll do H!) but right now I think 11.57pm is time to sleep!